Observability¶
Every run records a trace. Traces are observable by default: the demo dashboards work offline with no external services, and you can additionally ship traces to Langfuse or Postgres.
What a trace contains¶
A RunTrace is one run of the runtime (until astream/run ends):
- Agent spans (
AgentSpan) — what each agent did: artifact reads and writes, and the key/value summary of the patch it produced. - LLM calls (
LLMCall) — prompts, responses (truncated), token usage, latency. - Timing and ordering — the whole causal chain of a run, in order.
RecordingLLM wraps your provider for free, so LLM call tracking needs no
code — just wire it at resources time.
Storing and viewing¶
SQLite store + web dashboard (local, offline)¶
from reactifact.tracing import TraceStore

store = TraceStore("traces.db")   # SQLite sink; also serves runs back to the UI
The store's interface is async (export/query/get); the SQLite core runs in
a worker thread, so the same object works in a web app and in plain sync code.
The dashboard is a FastAPI router mounted on your app:
from reactifact.tracing.web import create_trace_router

app.include_router(create_trace_router(store), prefix="/traces")
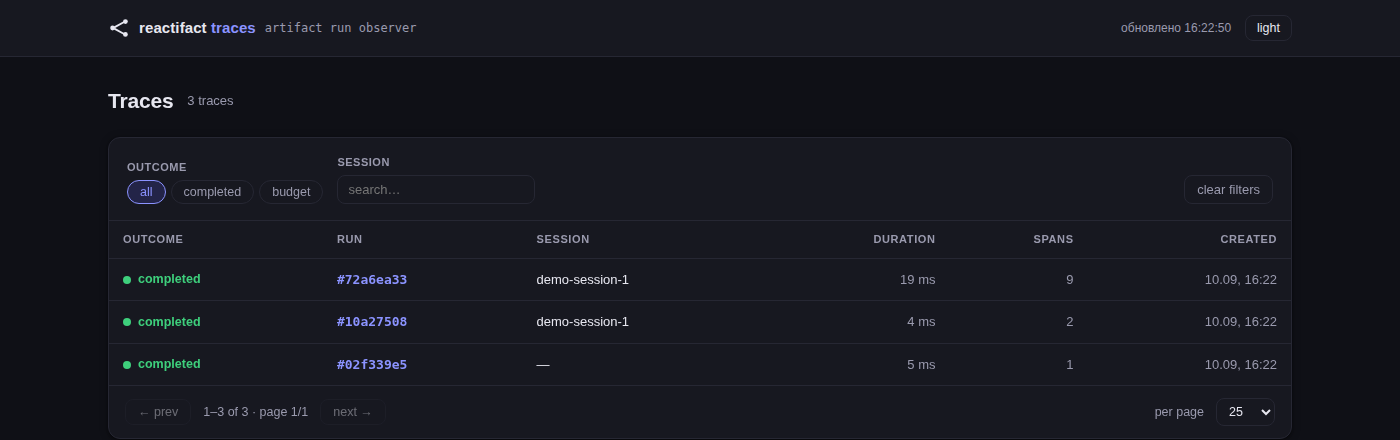
It serves traces.html (list of runs, filterable) and run.html (spans, reads,
writes, LLM input/output, timing, plus two live Mermaid diagrams: the run's
sequence and its evidence graph — written artifacts with patch.link
provenance edges, §34). The devops example mounts this router and is the
reference UI.
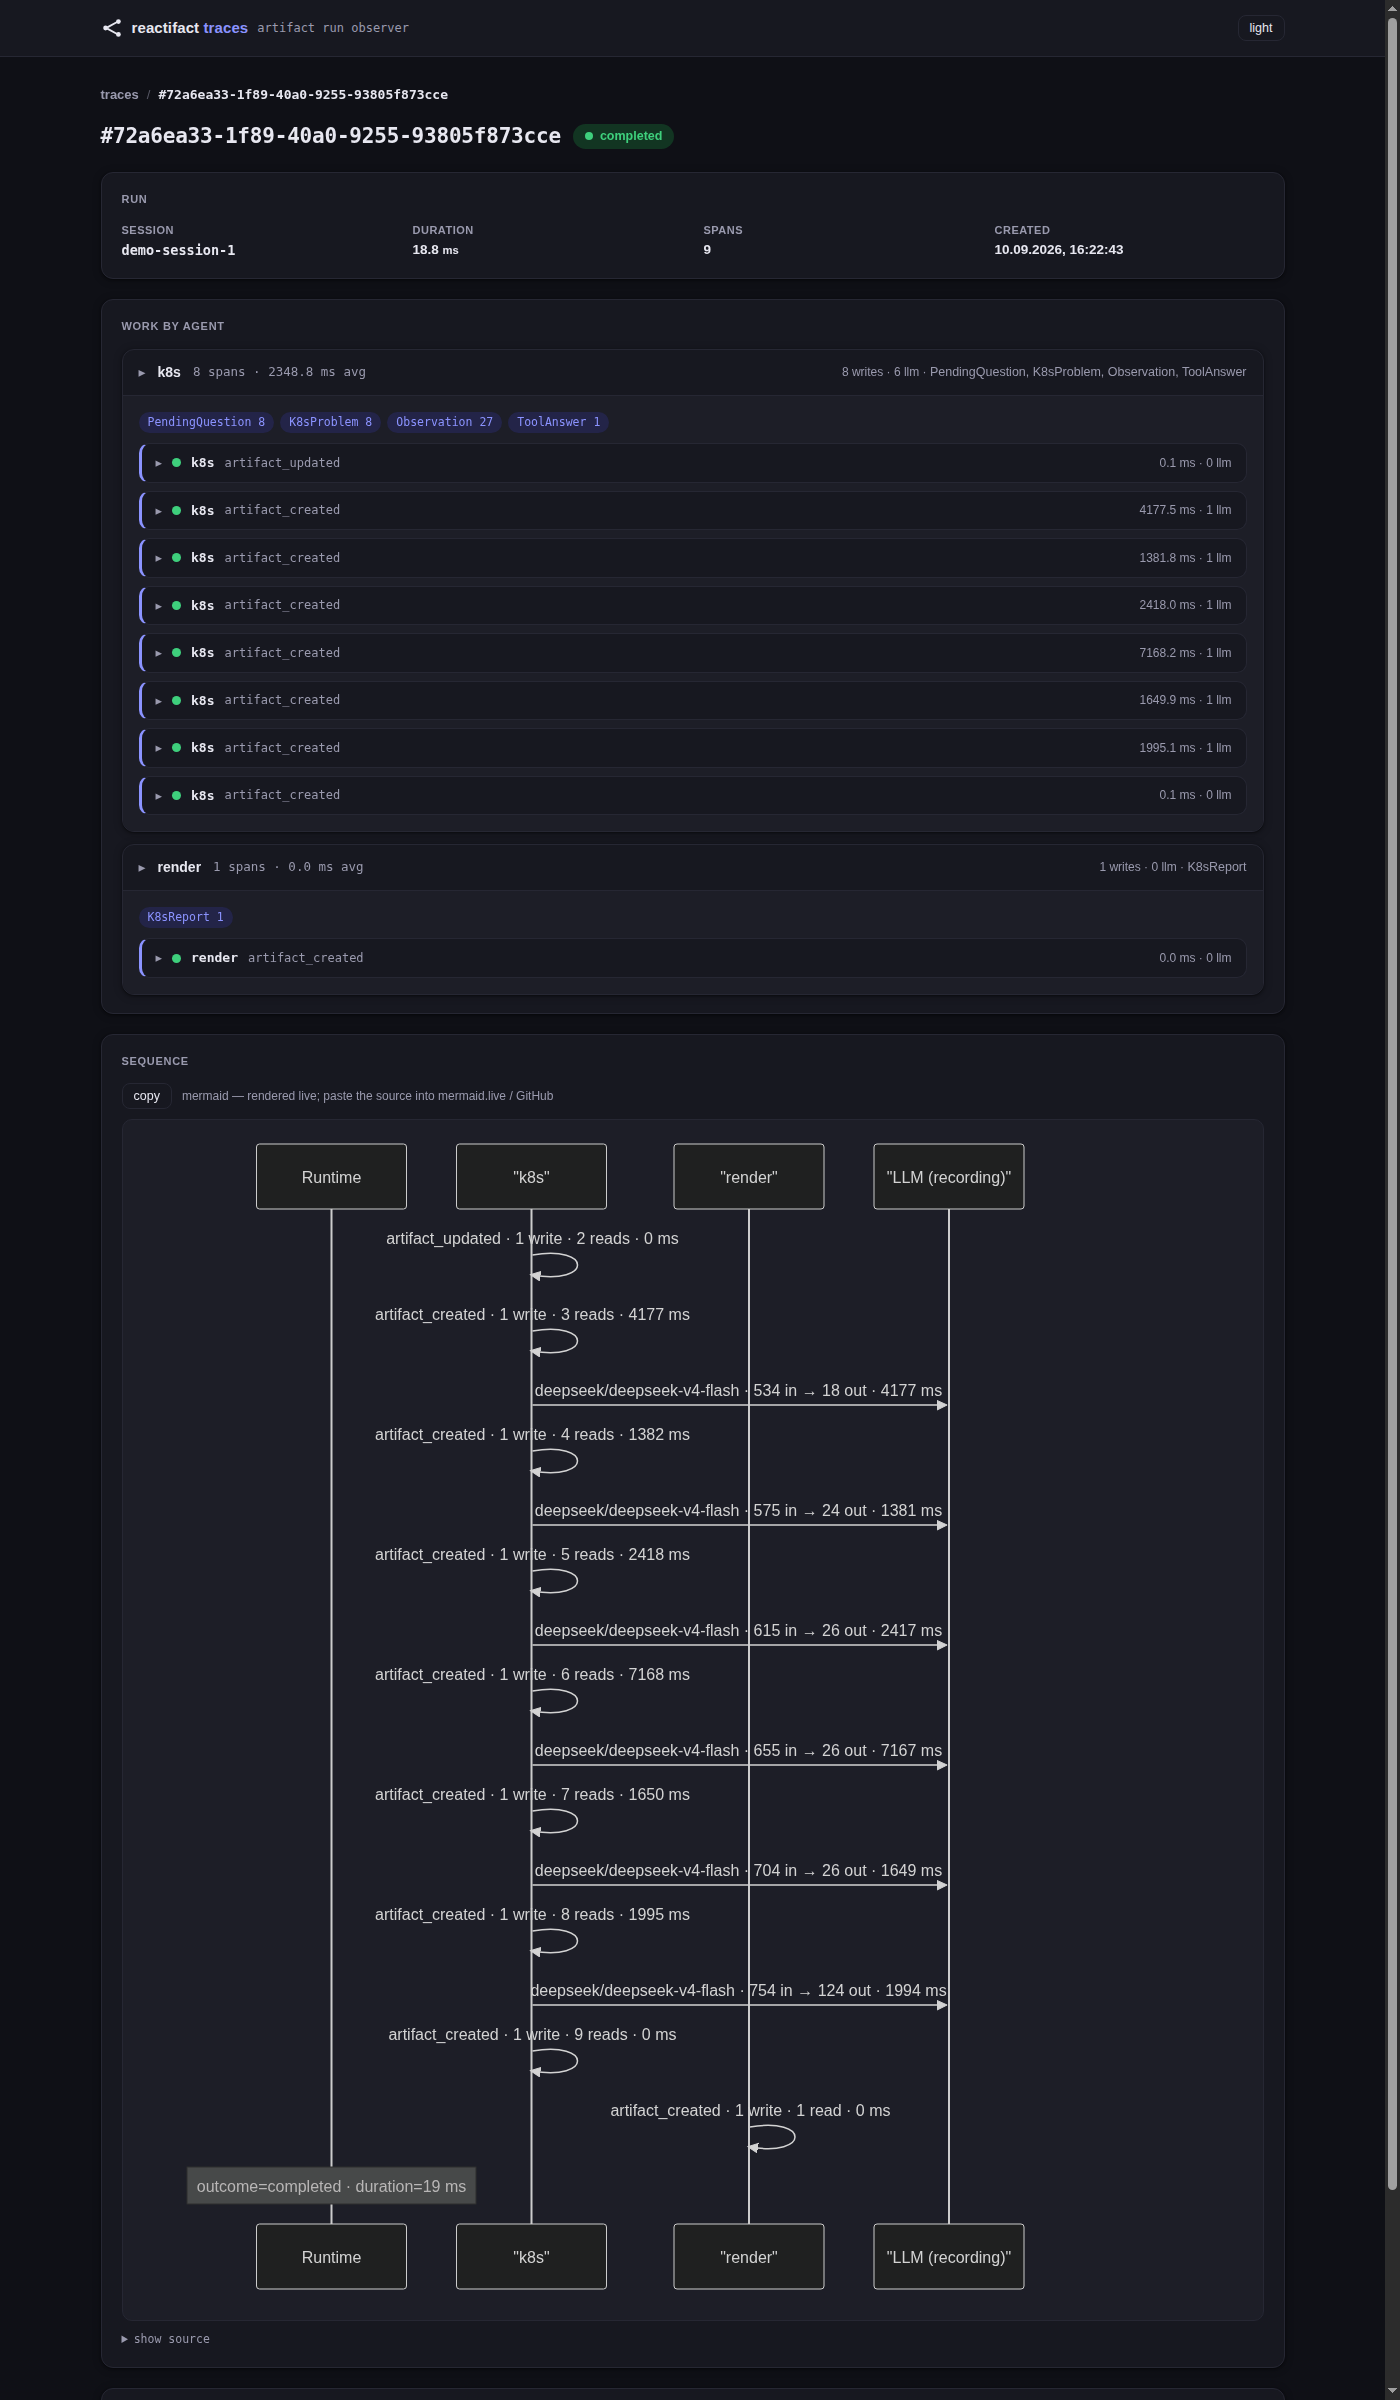
Opening a run shows work grouped by agent (span count, artifact types touched)
and the full sequence diagram — here the devops example's HITL ask/resume
flow: k8s calls the model across several artifact_created spans, then
render builds the final reply:
Langfuse and Postgres as additional sinks¶
A trace can go to several places at once via CompositeTracer, passed to the
Runtime. Tracers are thin: on_turn_begin → on_span → on_turn_end
(only on_turn_end performs I/O; sinks export asynchronously).
from reactifact import Runtime
from reactifact.tracing import LangfuseTracer, PostgresStore, TraceStore

runtime = Runtime(
    ctx,
    agents=[...],
    tracer=[
        TraceStore("traces.db"),                        # local dashboard
        LangfuseTracer(public_key="...", private_key="...",
                       host="https://cloud.langfuse.com"),
        PostgresStore(dsn="postgresql://…"),            # pg extra required
    ],
)
Spans are delivered once per turn end (delivery-once semantics); the Langfuse
tracer maps read/write summaries into input/output, so the timeline is
readable in their UI. The SQLite TraceStore stays a source for the web
dashboard; Postgres mirrors the same runs/spans schema.
Both TraceStore and PostgresStore implement TraceReader (async
query/get), so create_trace_router works against either: point the
dashboard at PostgresStore(dsn) to view traces written to Postgres without a
local SQLite file.
OTLPTracer: any OTLP/HTTP collector¶
LangfuseTracer is Langfuse-specific (its own langfuse.* attribute
namespace). OTLPTracer exports the same run as vendor-neutral spans —
GenAI semantic-convention attributes only (gen_ai.*, plus a
reactifact.* namespace for reads/writes/provenance) — to any OTLP/HTTP
collector: Jaeger, Tempo, Honeycomb, Datadog Agent, a local
otel-collector, ...
from reactifact.tracing import OTLPTracer

runtime = Runtime(
    ctx,
    agents=[...],
    tracer=OTLPTracer(endpoint="http://localhost:4318/v1/traces"),
)
No opentelemetry-sdk dependency — like LangfuseTracer, it POSTs the
OTLP/HTTP JSON payload directly over httpx (already a core dependency), so
this needs no extra to install. Pass headers= for a collector that
requires auth.
Emission model¶
- Only state-changing agents emit spans (a pure read/verify produce emits nothing — less noise).
- One
TracerperCompositeTracer: hand the same composite to multiple sinks. on_turn_endis the single delivery point: a newastream/arunadvances the run id (a re-run counts as a new run), and each turn's trace is finalized once.
Tracing never fails the run¶
Observability is best-effort by contract. A sink that is unreachable
(Langfuse down, Postgres refusing connections), a custom Tracer callback that
raises, or a malformed trace payload is caught, logged as a warning, and
skipped — the business run completes normally and the next turn is traced as
usual. When several sinks or tracers are configured, a failing one never
prevents the others from receiving the trace. Losing observability should never
mean losing the run it was only supposed to observe.
Redacting sensitive data¶
Traces leave the process (SQLite, Postgres, Langfuse, a dashboard, a log
line); the working Context — and, when a session is saved, the resumable
conversation — does not. Set redactor= on RuntimeResources to scrub the
text that leaves: artifact data, LLM messages/response, and span/LLM
error. The live state and persisted sessions are deliberately not
redacted — masking the working copy would corrupt a conversation that is
supposed to resume.
from reactifact import RuntimeResources
from reactifact.redaction import RegexRedactor

resources = RuntimeResources(llm=from_env(), redactor=RegexRedactor())
The built-in RegexRedactor is conservative on purpose — email, US SSN, IBAN,
Bearer tokens and sk-…-style API keys — so it never masks a legitimate
financial figure; pass patterns=[(name, regex), …] for a project's own
formats (cards, phones, …). Any object with a redact(text: str) -> str method
satisfies the hook, so a PII service drops in without subclassing. None (the
default) leaves traces byte-for-byte as before.
Progress events (UI reactivity)¶
For the animated "Думаю… / Составляю план… / Считаю смету…" lines, Produces
call context.announce(message, kind=..., **payload). Those become
ProgressEvents on the EventHub, which the runtime yields to the SSE stream:
async for event in runtime.astream():
    if event.kind == "status":
        yield sse("status", {"message": event.message})
announce is not a log — it is a first-class UI channel that the web demos
consume verbatim.