Observability
See exactly what every LLM call in a run actually did — the full graph, one span per node, and the complete request/response of every model call, prompt included — in a self-hosted web dashboard. Think "local Langfuse", but zero extra services to run.
A GraphObserver sits between graph.run() and an exporter. It captures:
- the graph topology (nodes + edges) for visualisation,
- one span per visited node (timing, status, errors),
- every LLM call with its full payload — the exact
messagessent to the model, the response, tokens, latency, cache hits, - every tool call (name, arguments, result, ok/error) parsed out of the LLM message stream, so a node's tool usage is a first-class entry rather than a buried message.
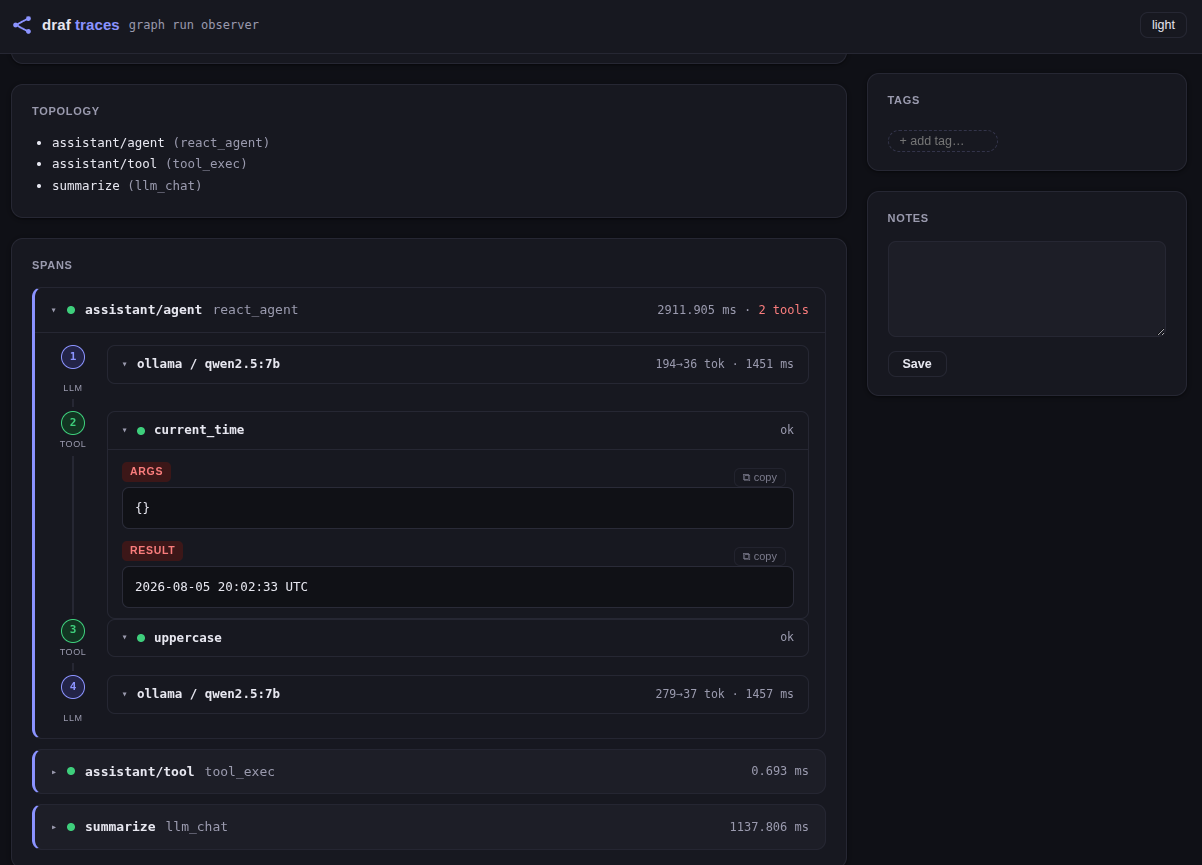
Inside a node span, LLM calls and tool calls are merged into a numbered
event timeline — a ReAct agent with two tool rounds renders as
1 llm → 2 tool → 3 llm → 4 tool → 5 llm, each step expandable to its full
prompt/response and tool args/result. A node visited several times in one
run (react loops, retries) accumulates into a single span in order, instead
of keeping only the last visit.
The captured run lands in SQLite (browseable in the browser), a JSONL file, or is pushed over HTTP to our collector or to langfuse / langsmith. Traces never block or crash the workflow.
Zero-code: the observability: block
The easiest path is declarative — a top-level block in workflow.yaml that
teff run and teff daemon pick up automatically:
name: my-workflow

observability:
  db: ./data/traces.db            # local SQLite store (our dashboard)
  export:                          # optional: also push to remote sinks
    - type: webhook               # any HTTP endpoint (e.g. our obs-server)
      url: http://obs:8001/obs/ingest
    - type: langfuse              # langfuse public API (Basic auth)
      host: https://cloud.langfuse.com
      public_key_env: LANGFUSE_PUBLIC_KEY
      secret_key_env: LANGFUSE_SECRET_KEY
    - type: langsmith             # langsmith runs API (x-api-key)
      api_key_env: LANGCHAIN_API_KEY
      project: my-project

steps:
  - id: answer
    type: llm_chat
    config: {model: llama3.1:8b, output_key: reply}
db:resolves relative to the workflow file; the folder is created if needed.- Sinks are fanned out to all exporters at once; a failing sink is retried and logged, never crashes the run.
- Secrets come from environment variables (
*_env), never from the file.
Browse the store in the browser:
teff obs-server --db ./data/traces.db --port 8001
# open http://localhost:8001/obs/ui
Full trace in code
GraphObserver wires into any graph.run() via two channels — structural
events (tracer) and the raw LLM payloads (on_llm_payload):
from teff.observability import GraphObserver, SQLiteExporter, topology_from_graph

observer = GraphObserver(
    "repair-agent",
    exporter=SQLiteExporter("./data/traces.db"),
    topology=topology_from_graph(graph),
)
state = await graph.run(
    state,
    tracer=observer.tracer,  # node/edge/checkpoint events
    on_llm_payload=observer.on_llm_payload,  # full prompt/response
)
observer.export()
That's the whole wiring. graph.stream() works the same way.
The dashboard UI
The SQLite exporter doubles as the dashboard query layer. Mount the UI on any
FastAPI app — this is exactly what teff obs-server does:
from fastapi import FastAPI
from teff.observability import SQLiteExporter, attach_dashboard, attach_ingest

app = FastAPI()
exporter = SQLiteExporter("./data/traces.db")
attach_dashboard(app, exporter)  # GET  /obs/ui, /obs/runs, /obs/runs/{id}
attach_ingest(app, exporter)  # POST /obs/ingest (accepts Run.to_dict())
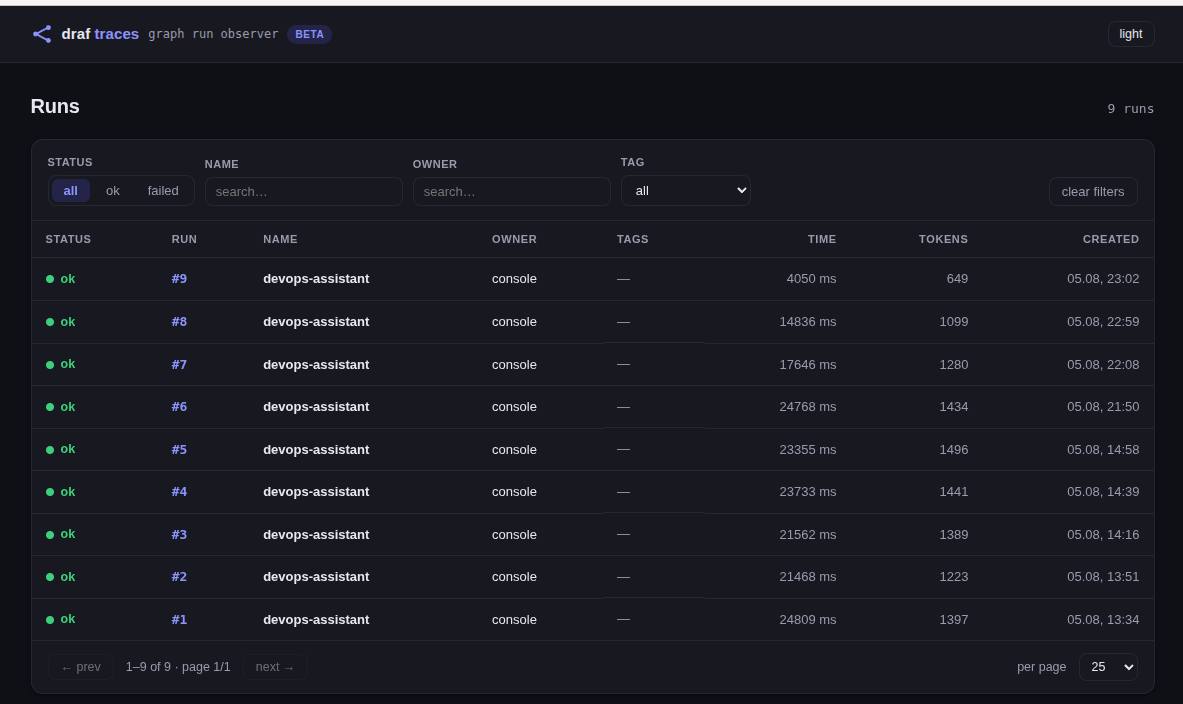
GET /obs/ui— the dashboard: runs list with status/tag filters and pagination, dark theme by default.GET /obs/runs/{id}— a dedicated page per run: the graph, node list with per-node tool calls and LLM payloads (prompt and response side by side), plus editable tags and notes.PATCH /obs/runs/{id}— update a run'stags/notes.
Centralising traces: teff obs-server
Workflows that have no API (declared purely as workflow.yaml) push their
traces to a central collector over HTTP; the collector serves the same
dashboard:
observability:
  export:
    - type: webhook
      url: http://collector:8001/obs/ingest
teff obs-server --db /data/traces.db --host 0.0.0.0 --port 8001
Bind the collector to anything but loopback (127.0.0.1/localhost) and it
refuses to start without an API key — pass one with --api-key or the
TEFF_OBS_API_KEY env var. Traces can embed full prompts and responses, so
the dashboard and its /obs/* API are protected by that same key; turn them
redacted at the source with GraphObserver(..., redact=True) (the default).
Or run the published image:
docker run -d -p 8001:8001 -v teff-traces:/data \
  bzdvdn/teff-obs:latest --db /data/traces.db --host 0.0.0.0
Any number of machines can push into one server — cron jobs, daemons,
serverless functions. Each POST is one completed Run in to_dict() shape;
sends happen in a background thread with retries, so a slow collector never
slows the workflow.
External sources: langfuse / langsmith
The push exporters adapt a Run to the vendor trace schema and use urllib
in a background thread — no SDK dependencies, credentials come from the
environment:
| Exporter | Endpoint | Auth | Env vars |
|---|---|---|---|
HttpExporter |
any URL / obs ingest |
optional headers: |
url or url_env |
LangfuseExporter |
POST /api/public/traces |
Basic (pk : sk) | LANGFUSE_PUBLIC_KEY / ..._SECRET_KEY |
LangsmithExporter |
POST /runs/batch |
x-api-key |
LANGCHAIN_API_KEY (optional LANGCHAIN_PROJECT) |
Every node becomes a span (chain) and each LLM call a generation (llm run),
nested under its node, with full input/output.
Exporters in one place
SQLiteExporter— the dashboard backend (also the query layer).JsonlExporter— one JSON line per run (great for pipelines).CompositeExporter— fan one run out to several sinks; a failure in one sink is isolated.HttpExporter/LangfuseExporter/LangsmithExporter— remote push, asynchronous, retried.build_observability/build_observer_factory— turn a YAML block into an observer (used by the CLI; the factory shares one exporter set across daemon ticks).